Monitor
Link monitoring is focused on monitoring resources that are required to run, for the EDI system so work properly.
It is not intended to replace surveillance tools like SCOM or others. However since there may be some overlap in responsibility for surveillance, an xml result from monitor can be used to plug-in the status from Link monitor into SCOM or other surveillance tools. This way you don’t have to configure some of the same monitor items twice.
On the monitor page you can get an overview of how various systems and services in your Link solution are doing. A green color means that the service is healthy and everything is working properly, and a red color means that there is a problem with the service that needs to be fixed.
If you see a flashing red exclamation mark on a monitor group, it means that one or more monitor items in that group is not responding. Normally this means the monitor service has either not started, or has crashed.
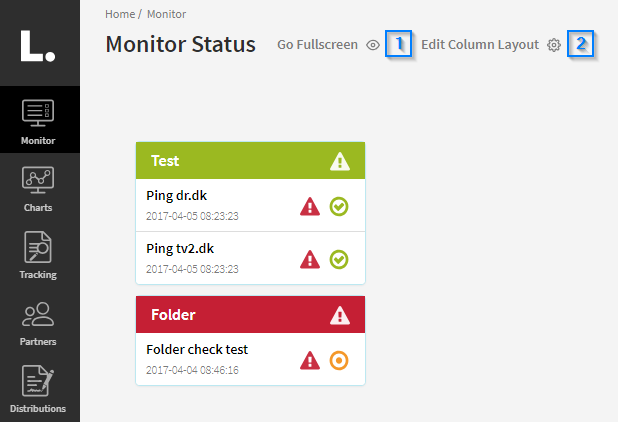
The services are divided into groups for easier navigation. In the example screenshot above there are two groups of monitoring items: Test and Folder. Click the group header to show/hide the items.
Click a monitoring item to see further details about it. A new window will open, showing you a list of statuses and their descriptions. See the 'Monitoring Item Details' section on this page for more information.
Go Fullscreen [1]
Click here to make the window fullscreen. This will hide the left navigation menu and the login information in the upper right corner. Press F11 to return to the standard view.
Edit Column Layout [2]
Press here to rearrange the layout of the monitor page. Once pressed, you can drag and drop the various monitoring groups to your liking. When you are happy with your changes click 'Save Column Layout' or press 'Cancel Column Layout' to abort and return to the previous layout. See the animation below for reference.
Monitoring Item Details
On this window you can see the flow of statuses of a specific monitoring item. Each status has a timestamp and a description.
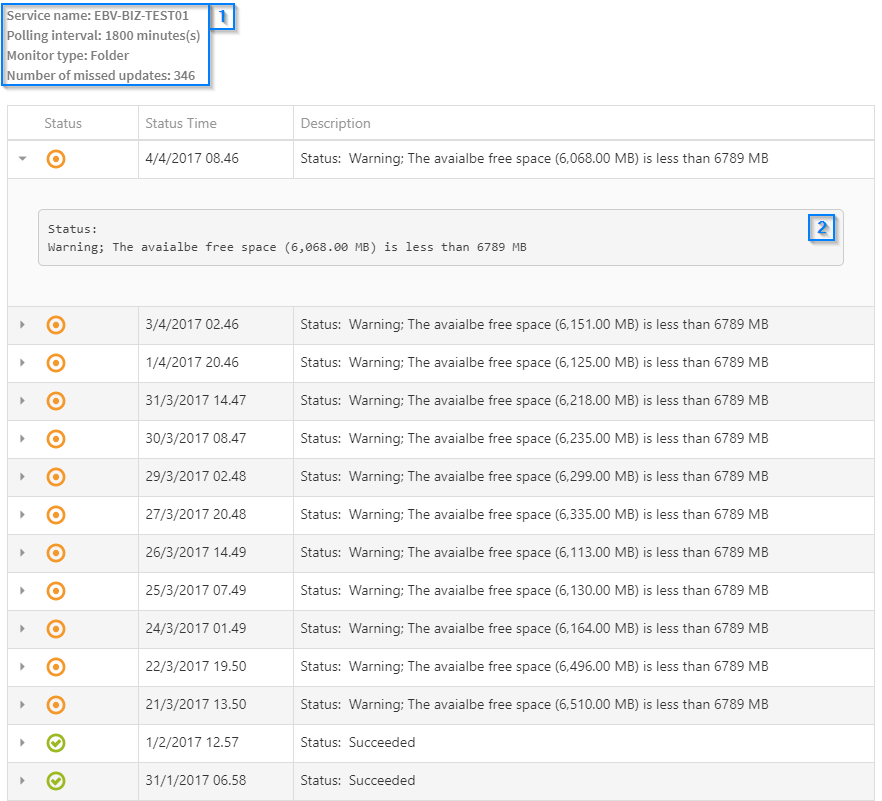
At the top of the window several pieces of information are displayed [1].
-
Service name: The name of the service being looked at, e.g. a server, folder etc.
-
Polling interval: How often the service is being polled in minutes.
-
Monitor type: The type of monitoring item.
-
Number of missed updates: How many updates that have occured on the service which have not been looked at.
To see the full description of a status [2], click the arrow to the left of the status symbol in the leftmost column.
Content on this page: