The monitor status page provides a visualization of the status of the configured monitor items. Any user with access to it can look at it whenever they want, but a common use case is to have a dedicated physical monitor display it at all times in the office of the department in charge of the integration solution. It provides a real-time color coded overview of the health of the integration solution, provided that the requisite monitor items have been created and configured correctly.
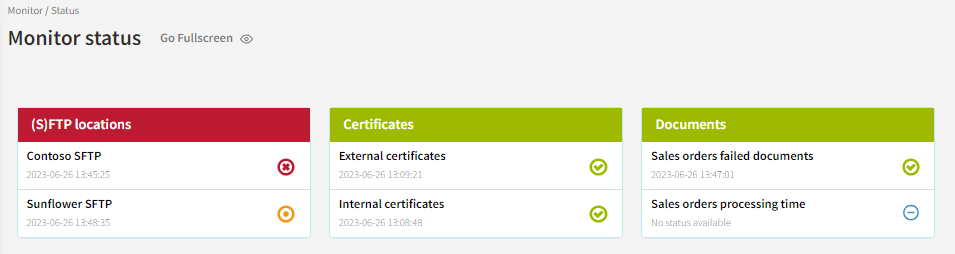
The status of a monitoring item is shown using four different icons:
|
Icon |
Meaning |
|---|---|
|
|
OK |
|
|
Error |
|
|
Warning |
|
|
None (the item is disabled or the item hasn’t been updated yet) |
In the visualization, a group displays the highest status level of the monitor items it contains. As such, if a group contains 4 monitor items that all have the status “Ok”, then the group also has the status “Ok”. If one of the items changes to status “Error”, the group changes to “Error” as well. If another item changes status to “Warning”, the group remains at status “Error”, since that is still the highest status among the items it contains.
When clicking an individual monitor item you can take a closer look at it’s detailed log information.
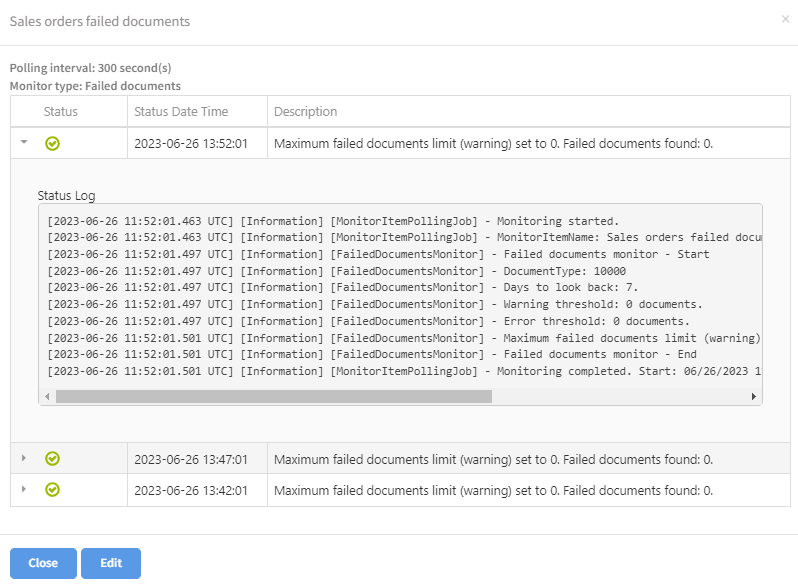
The log both provides information about the configuration of the monitor item at execution time and also a detailed stack trace in case of errors.