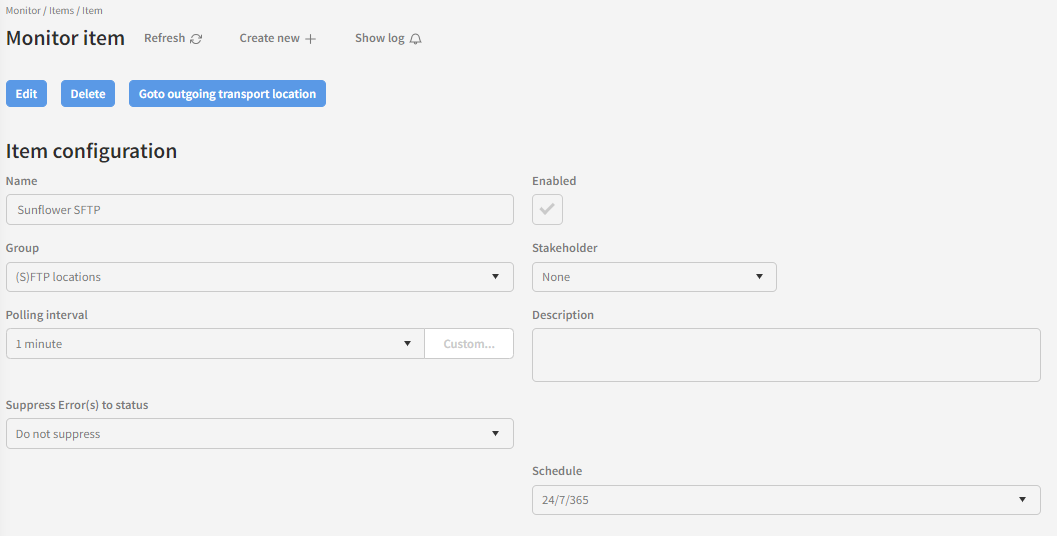
To set up a monitor item, you need to fill out some information. Each field is described below.
Note that for Embedded monitor item types, you have to go to the specific transport location to be able to create and fully maintain the monitor item.
-
Name
-
The name of the monitor item. This is visible in the monitor items list and on the monitor status page. As such, it should be descriptive enough that it tells what this monitor item does.
-
-
Enabled
-
Whether the monitor item should currently be active or not.
-
-
Group
-
Which monitor group the item belongs to.
-
-
Stakeholder
-
Which stakeholder (if any) the monitor host should send emails to when this item reports an error. If you’re unsure about this term, we recommend that you read the Stakeholders chapter.
-
-
Polling interval
-
How often this monitor instance should run.
-
-
Description
-
A text description of what this monitor item does.
-
-
Suppress Error(s) to status
-
This lets you suppress errors reported by the monitor a configurable number of times. See more detailed explanation below.
-
-
Type
-
This dropdown lets you choose between the standard monitor types installed on the system.
-
-
Schedule
-
At the time of this writing, only 24/7/365 is supported, but it will soon be possible to create custom schedules.
-
Error suppression
This feature allows you to suppress errors a configurable number of times. There can be many reasons why you might want to do this.
Let us say, for instance, that you are sending documents to a partner’s service endpoint. You would like to be notified if the endpoint becomes unresponsive or otherwise cannot be reached. However, you also know that the partner periodically deploys updates to the server hosting the endpoint, resulting in the endpoint being unreachable for a few minutes. Since this is a normal scenario in the day-to-day operations, and the retry functionality of the transport location sending the documents handles it just fine, you don’t want to have an email sent to the stakeholder whenever this happens.
What you can do then, is to configure the monitor checking the connection to the endpoint to suppress errors the first few times they occur. Let us say the monitor is configured to run every 5 minutes, and you know that the service endpoint’s maintenance window is always less than 10 minutes. As such, you only want to notify the stakeholder if the endpoint is unresponsive for more than 10 minutes at a time. You then set up the monitor to suppress errors the first 2 times they occur. Whenever the service endpoint goes down for maintenance, the monitor will register the error, but report the status you chose to suppress errors to (either Ok or Warning). As long as the endpoint comes back online before the 2nd time the monitor runs after it first registered the error, no email will be sent to the stakeholder. Only if the monitor registers an error 3 times in a row will the effective monitor status change to Error, and an email will be sent to the stakeholder.
Type specific configuration
Once you have chosen a monitor type for your item, the configuration fields specific to that type are shown.
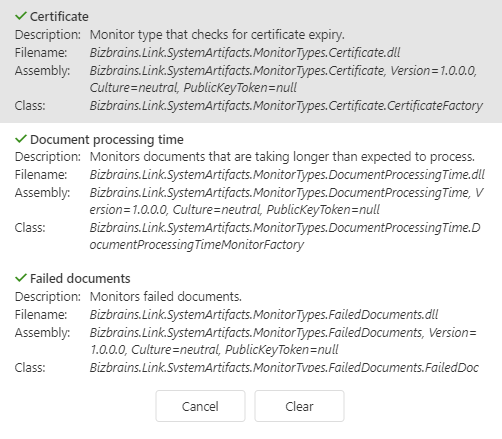
At the time of this writing, you can choose between monitoring of “Certificate”, “Document processing time” and “Failed documents”. Each of these monitor item types have individual configuration items.
Hover you mouse over each field label to read about each option. Remember to also familiarize yourself with the Embedded monitor item types.
Editing embedded monitor items
If you are editing an embedded monitor directly via the monitor item list page, you can jump to the corresponding transport location maintenance page by clicking the “Go to outgoing transport location” action button.