Monitor Config
On the monitor config page you can create new monitoring items and groups and see them listed in a data grid. The tabs at the top of the page [1] allow you to switch between monitor items and groups. By default the monitor items are shown. See the screenshot below for an overview.
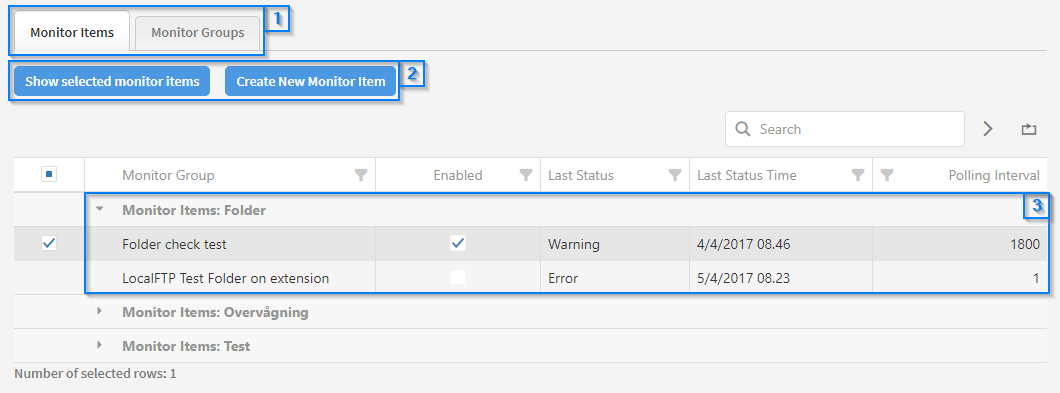
Tabs [1]
Click a tab to change the current page to show either monitor items or monitor groups. To create a monitor group or item, the corresponding tab must be active. Any selected rows in one tab will be saved when you switch tabs.
Action Buttons [2]
These buttons allow you to see the details of a specific monitor item or group as well as create new ones. The basic functionality of the buttons are the same for both monitor items and groups. Each button will be described for both monitor items and groups.
Show selected monitor items
Click this after having selected one or more items in the data grid. You will be redirected to a new page showing you the details of a particular monitor item. This is described on the 'Monitor Item Detail' page in the user guide.
Show selected monitor groups
Click this after having selected one or more groups in the data grid. You will be redirected to a new page showing you the details of a particular monitor group. This is described on the 'Monitor Group Detail' page in the user guide.
Create new monitor item
Click here to create a new monitor item. You will be redirected to a new page allowing you to fill in the details of the item. This is described on the 'Create Monitor Item' page in the user guide.
Create new monitor group
Click here to create a new monitor group. You will be redirected to a new page allowing you to fill in the details of the group. This is described on the 'Create Monitor Group' page in the user guide.
Expand monitor items [3]
Click the arrow to the left of the name in the 'Monitor Group' column to expand a group of monitor items. Doing so will allow you to see the information for each monitor item in the data grid, such as last status and the polling interval. Click the arrow again to retract the monitor items group. When expanded, you can select individual monitor items by ticking the checkbox in the rightmost column.
-
Monitor Group: Defines the group the monitor item is in.
-
Enabled: If ticked the monitor item is enabled and will show up on the monitor page.
-
Last Status: Shows the most recent status of the monitor item.
-
Last Status Time: Shows the date and time the last status was registered.
-
Polling Interval: Shows the interval in minutes between each status check.
Content on this page: